Findings from the Comprehensive Interviews of Attendees at the 2010 KBIS* Show
Introduction
Interline Creative Group, Inc., a full-service marketing organization, exhibited at the 2010 K/BIS show. Their intention was to gather information useful to their clients. For this purpose, Interline retained Accountability Information Management, Inc. to conduct research in their booth. The offer was simple: $5 for 5 Minutes. Over the three days of the show, we conducted over 200 interviews with designers, architects, showroom consultants and others. These were open-ended questions – no “hints” or “choices” were given to the attendees. AIM then compiled and standardized the results into this report. Interline’s goal was to better understand the audience, which many of their clients seek to reach.
We hope you find the report useful for your own marketing purposes. If you have any questions after you have reviewed it, please call Jim Nowakowski, President, at 847-358-4848.
Thank you very much.
Overview
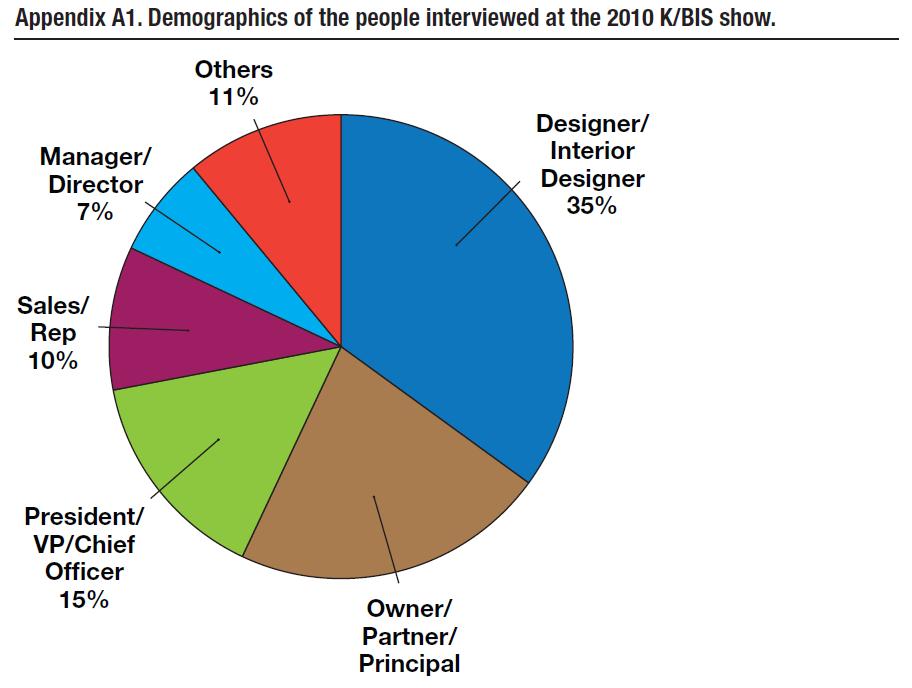
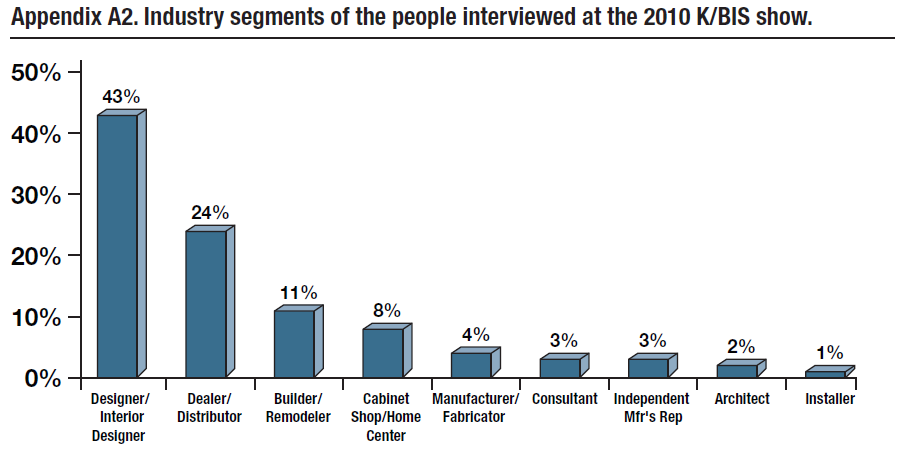
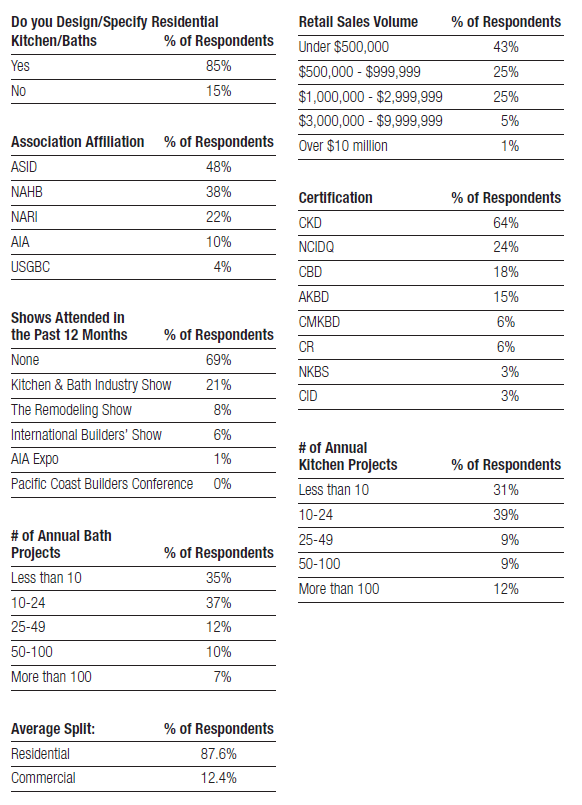
The composition of those interviewed was “high caliber” – as evidenced by the first graph in Appendix A – 44% are either owners or at a senior level in their organization. For those seeking to reach these individuals in the kitchen and bath community, the information within this report will be reflective of those who, in fact, “play in it.” 85% of these people said that they specify and recommend kitchen and bath products. 69% of them had sales below $1M. For additional demographic breakdowns along with these charts, refer to Appendix A.
1. The first question asked: What has the biggest impact on the way you design projects?
42% said, “The client.” Another 33% said, “The Budget.” Combined, we can safely conclude that this audience “listens to their customers!” As one of the designers put it, “They (our customers) know what they want and expect us to be knowledgeable.” Another said, “The smile on their face.” The people we interviewed were customer focused – in almost everything they told us. According to them, it’s their customer’s likes and dislikes that govern their design choices. Looking closer at “the client,” 32% indicated it was their customer’s preference or “wants” that was driving the design of their project. Another 29% indicated it was the client’s needs that were the driving force. This may indicate that what the client wants and what they need may be two different forces impacting design. The space, efficiency, durability of the products and materials they incorporate into their designs are important.
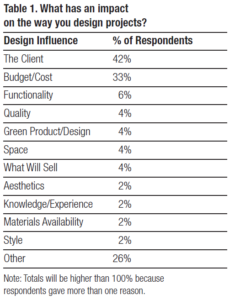
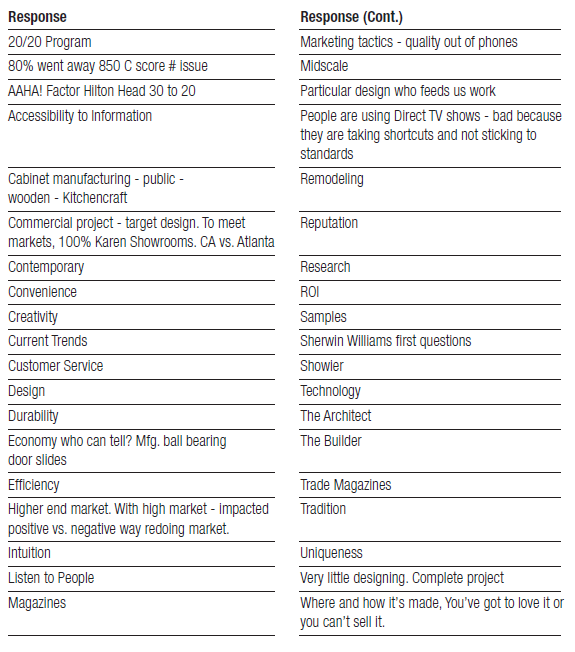
Interestingly, “Green Product Design” only shows up in 4% of the responses. A list of the “other” responses can be found in Appendix 1.
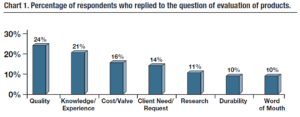
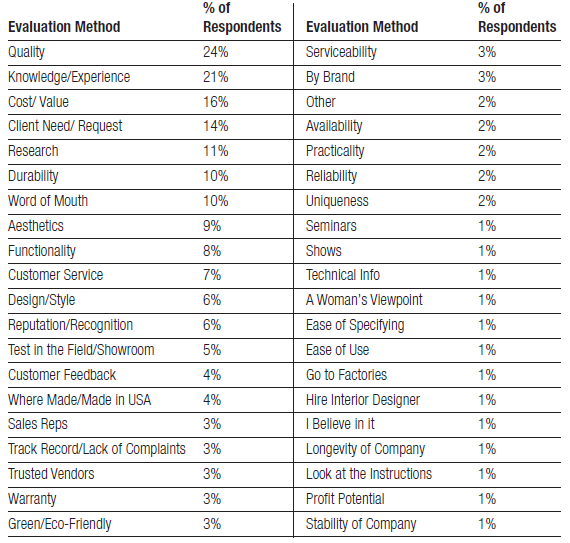
2. The second question asked attendees: How do you evaluate products that you recommend or select for your projects?
Respondents gave us over 40 different responses, and “quality” was the clear leader: 24% of the attendees said that “quality “is how they evaluated products they recommended and selected (Chart 1). This was followed by “knowledge or experience” – 21% said this. This means that almost half of those in our survey utilize quality and their own knowledge and experience to help them evaluate the products and materials they use for their designs.
They defined quality with words such as “construction materials” or “finishes.” And they define “experience” with comments such as “depends how long I’ve used the product.” And their judgment of those that do not deliver quality is harsh, and final: “If I have any problem or hassle with a manufacturer’s product, I never use them again.” Many designers conduct research on the products they recommend to clients—talking to reps, installers, and rely heavily on recommendations from other professionals in the industry.
Appendix 2 contains the complete list of responses.
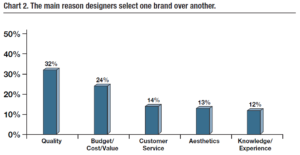
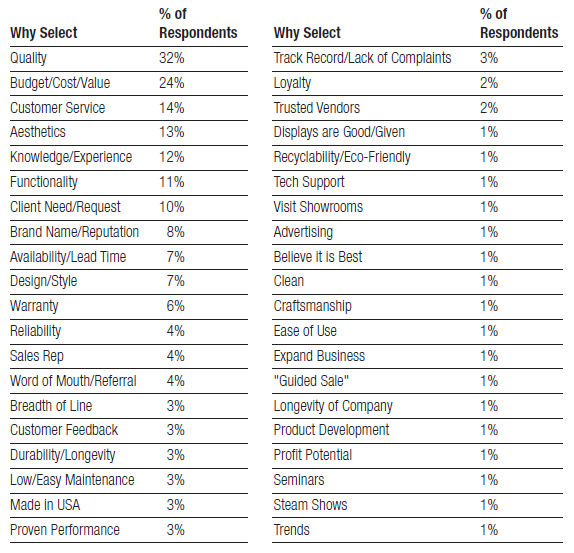
3. The third question was deliberate: Why do you select one brand over another?
As in the previous question about evaluation, the selection of a brand over another was responded to most by the word “quality” – 32% said this. But instead of “knowledge and experience” as the second most mentioned, selecting a brand over another was judged by Budget/Cost/Value. But the fact is, all three of these are in the top five reasons why designers evaluate and select a brand over another. Appendix 3 lists all of the responses, along with the percentage of response.
Discussion
But this is where comparison becomes interesting. For example, while “quality” was the #1 reason designers evaluate or select one brand over another, and while knowledge, experience, budget and cost/value are all within the top five reasons, there are differences in the points of view of designers between evaluation and selection.
For example, “customer service” was ranked the 3rd most important factor when selecting one brand over another, but was only 10th in the evaluation process. So manufacturers can differentiate their product by the level of customer service they offer. Those manufacturers who, not only offer premier service throughout the designers experience, but market their ability to deliver service will be more apt to get the designer’s recommendation.
Another example of service is with the “Availability/Lead Time” of a product. Availability was one of the top ten reasons why a designer will select one brand over another. However, it was ranked 24th in the evaluation list! This means that designers rarely consider “availability” when evaluating a product. But in their decision to select it, availability and lead time become one of the top ten reasons for a product’s selection. Why is it that the designer doesn’t factor in availability during the evaluation process? Perhaps equally important, why doesn’t the manufacturer emphasize it in promoting to designers, since it is obviously important in the selection of the product?
“Durability/Longevity” is another interesting characteristic. In evaluating products, designers ranked this as the 6th most important characteristic. However in the actual selection of a brand over another, this characteristic drops to 17th in terms of ranking of importance. Again, the question is, why? Does durability lose any of its “draw” when actual selection takes place?
Can a non-durable product, in fact, be selected? Furthermore, if durability isn’t important in selection, why should a manufacturer promote it?
Another interesting characteristic is “Warranty.” In selecting a brand over another, it plays a much more important role in the designer’s behavior (ranked 11th) than in the evaluation of the product (19th). Like availability, shouldn’t manufacturers help designers understand the value of warranty in the actual evaluation process since it is important to their selection?
Bringing these characteristics closer together – like quality – would seem to make sense.
What is especially interesting to us is that “ease of use” is not important to the designer in either the evaluation or the selection of products (ranked 33rd and 32nd respectively)! Yet, promoting “ease of use” seems to be one of the most common themes of manufacturers to this audience!
So what can we conclude? That products must have quality, fit a client’s budget and needs, as well as the designer’s knowledge and experience. It must be functional, aesthetic and available.
Manufacturers should promote not only their ability to service their product, but the proof that their product will perform as promised.
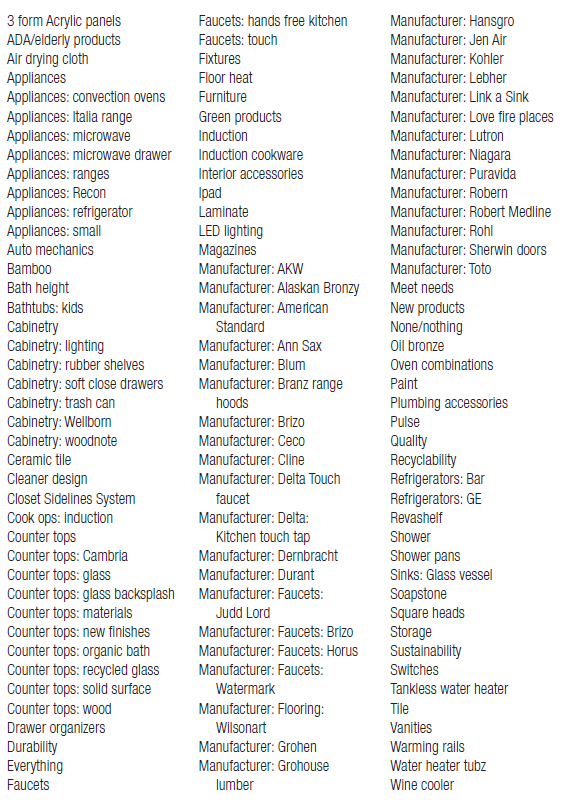
4. Question four tried to find out: Are there any recent products that you have used that you are excited about?
There were 149 individual responses to this question by the respondents with a variety of different brands and products mentioned (See Appendix 4). 35% of the designers mentioned a specific manufacturer, but several designers (18%) were not excited about ANY products they had seen or would see. Some of the top product categories of interest included counter tops, appliances, cabinetry and faucets.
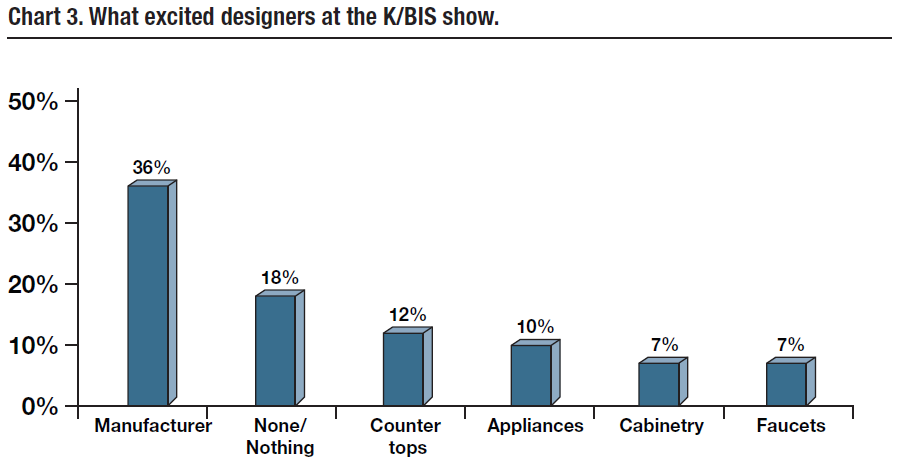
The diversity of responses is part of the kitchen and bath “business.” The top manufacturer mentioned by name was Kohler with 7% of the respondents excited about their products. Toto and Delta were each mentioned by 3% of the designers.
While Kohler is mentioned more often than other companies or technologies by the attendees, it is only one of over 50 different ones! It is a testimony to Kohler’s brand strength. But like other brands, Kohler finds itself occupying the “sea of brands” in designers’ minds.
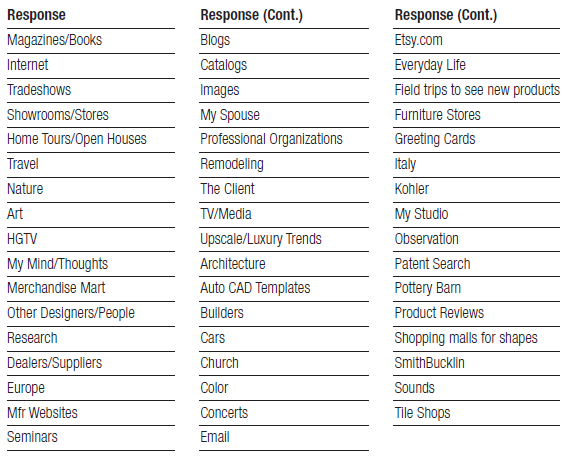
5. This question asked simply: Where do you go for inspiration?
Creativity drives design, and the search for inspiration is an unending one. Many of our prior surveys taught us that designers seek inspiration everywhere – and continually. This survey at the K/BIS show was no different in terms of the response to this question.
These creative people listed 54 different sources of inspiration! What may surprise readers of this report, however, is the number one source for inspiration: magazines and books!
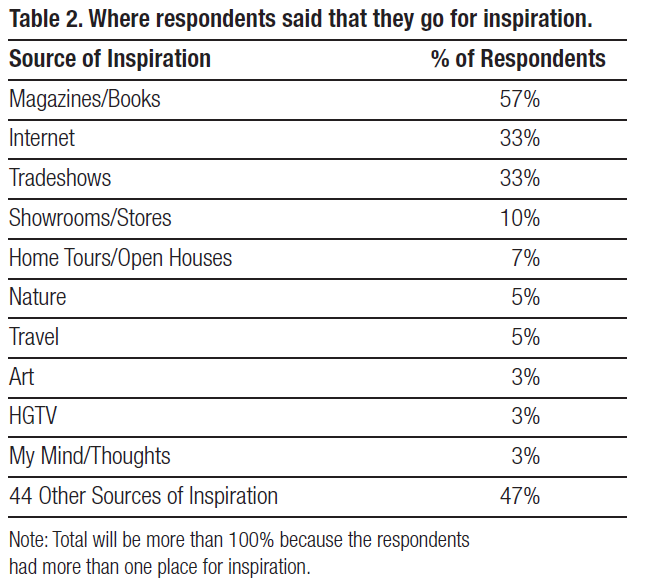
Table 2 shows this, and the other places the designers said they go for inspiration. What is remarkable in this age of the Internet is that they continue to find inspiration in magazines such as Architectural Digest, Builder, Elle Décor, KBDN, K+BB, Lux, Metropolis, and Interior Design among others.
Do advertisers know this? Just examine the “size” of these publications compared to other types of publications. Indeed, REED closed 23 magazines in one day a few months ago.
If a publisher like REED knew this, would they have elected to close the magazines, or, in fact, have the closed magazines simply failed to “inspire?”
Many designers utilize multiple sources for inspiration. Appendix 5 contains the list of sources of inspiration that were given.
6. In this question, we wanted to know: Where do you most often go to get product information?
As in the prior question, we were interested to learn where designers go to get specific product information. This response is significantly different than the prior question.
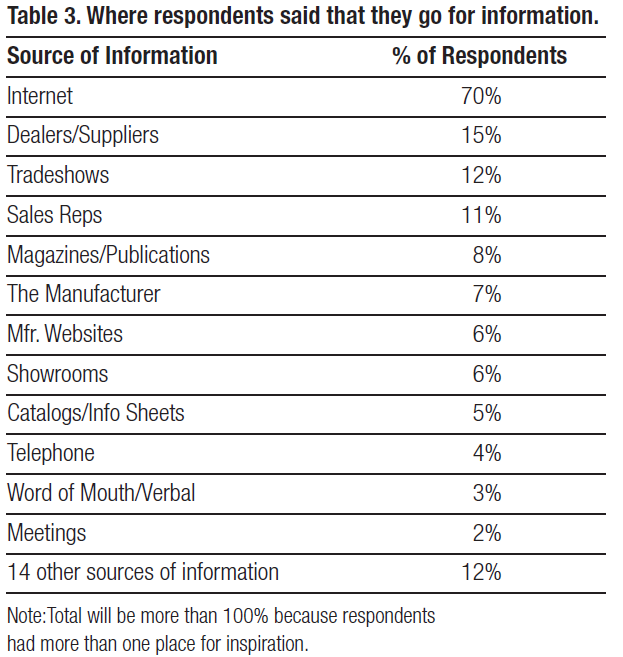
Here, magazines fall off to only 8% of the response – a far cry from the 70% of people who say they use the Internet for product information. But then, the Internet is an informational tool, is it not? “Texting” or “Social Networking” is about content, and though the Web grows more visual all the time, it is, after all, an informational exchange at the moment.
We just completed another brand preference survey for a client that surveyed homeowners and professionals like those found at K/BIS – and in both cases, the Internet was the top source for information. This was more so for professionals than homeowners, but nevertheless, still the top source for information.
One of the questions we had was this: Do people who use magazines for inspiration also use the Internet for product information, and likewise, will people who use the Internet for information still go to magazines for inspiration as their top source? The following table shows the results of this cross tabulation.
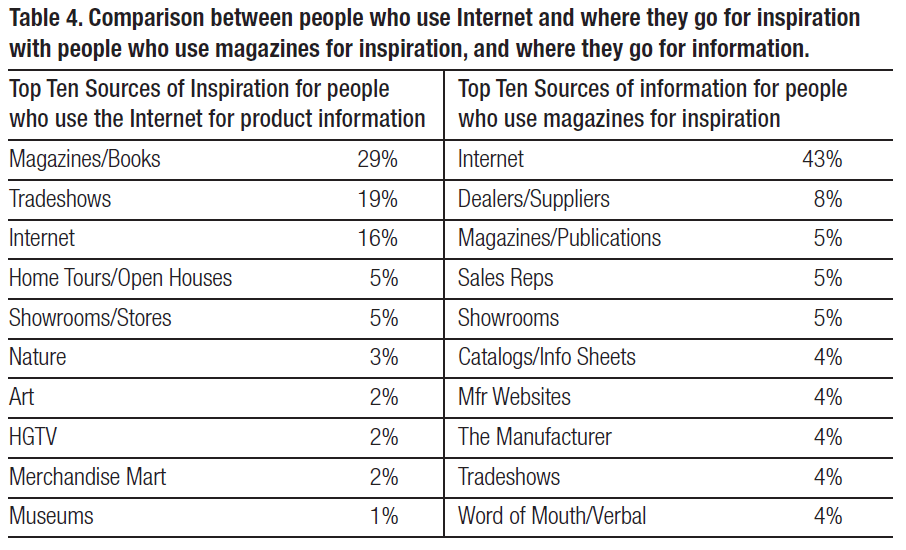
The answers to the questions are both yes! As shown in Table 4, people using the Internet for product information still go to magazines and books for information, and people who use magazines for inspiration use the Internet for product information. This shows the integration of print and Web, which people often talk about, but is expressed clearly in this survey.
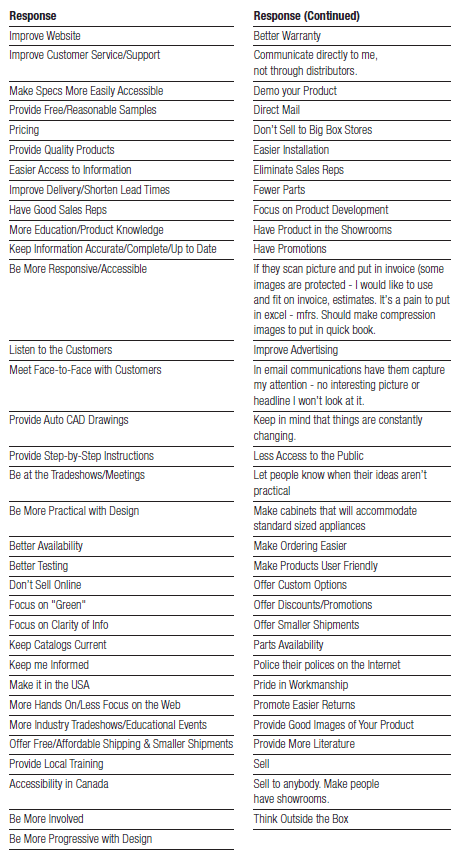
7. Finally, we asked: What manufacturers can do better for you?
People gave 65 suggestions, which can be grouped into similar suggestions, or individual suggestions. The following chart presents the top 10 suggestions, and Appendix 6 lists all of the suggestions.
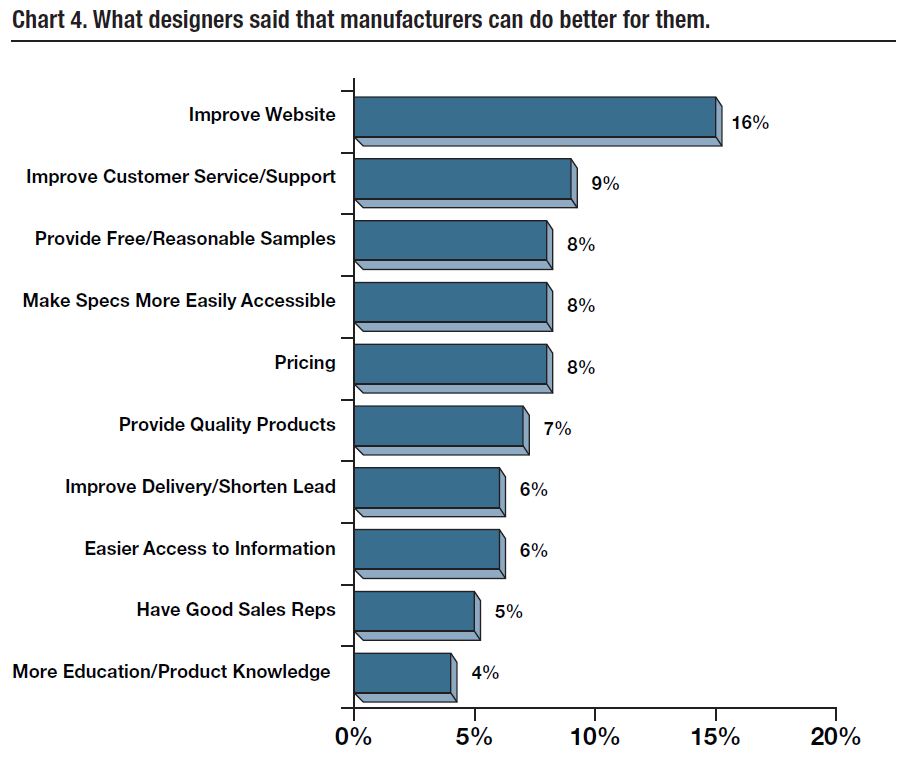
Improving Websites and providing specs more easily was something repeated. Since customer service is one of the top reasons designers select one brand over another, manufacturers need to continue to evaluate and improve customer service where needed. This comment was also heard: “Why have manufacturers become so stingy with samples?” This was said by more than one designer with emphasis, and shows up in the 3rd most often mentioned in what manufacturers can do better for the designer.
Interline’s Conclusions
The conversations AIM had with the designers at the show were extraordinary. They produced marvelous information – information that can help manufacturers market more successfully to the design community.
For example, “literature fulfillment” is an often discussed topic in the manufacturer community. Many manufacturers look at this process as one that can be “cut” to save money. But as one designer told us, “What is wrong with manufacturers? Why
have they become so cheap with their literature and make you download everything from a Website. Don’t they realize that you can’t sell it if you can’t show it?” Such “hard core” comments hit right to the heart of selling – demonstration!
Or, what about the two healthcare designers – one a professional RN – who talked extensively about “what’s wrong” with the product designs from an assisted living point of view. “I don’t know how many times I’ve tried to tell manufacturers, you can’t do that with elderly people…they just can’t stand there while the tub drains!”
Our business is exploring the selling process, and this report represents an exploration of the K/BIS audience – one that was thoughtful, rewarding, and one in which we hope you found of value.
If you would like information on our other explorations, please contact us at: 847-358-4848. Ask to talk to Jim Nowakowski, President. Thank you for your time and your attention.
Appendix A. Demographics (Continued)
Appendix 1. List of “other” responses to Question 1: What has the biggest impact on the way you design projects?
Appendix 2. List of how attendees said that they evaluate the products they use.
Appendix 3. List of how attendees said that they select one brand over another.
Appendix 4. What attendees are excited about.
Appendix 5. Where designers go for inspiration.
Appendix 6. What can Manufactures do Better?
IMPORTANT: Accountability Information Management, Inc. is in the business of managing market information. In our practice, we build databases in order to extract knowledge. We research and talk extensively to individuals involved in the business-to-business industry. We often go into detail during our conversations about not only their projects, but also their habits in terms of obtaining and using information in their jobs. This report and its contents are part of our methodology, products and services. It is copyright ©2018 by Accountability Information Management, Inc., 553 N. North Court, Palatine, Illinois 60067. This report is for the private use of the company named on the cover. Routine photocopying or electronic distribution outside of the named company and except for discussion purposes by that company is a copyright violation. Opinions expressed herein are intended to be CONFIDENTIAL. The Idea itself is the intellectual property of our company. For information on anything in this report, contact: Jim Nowakowski, 553 N. North Court, Suite 160, Palatine, Illinois 60067, tel: 847-358-4848, fax: 847-358-8089.